Correltech®
Activities of ADEXGO Kft. in the field of correlative analytical technologies
We are committed to the modernization of analytical technologies and the broad dissemination of new methods. Through our extensive experience and wide network of manufacturers and distributors, we help our partners in selecting and/or developing the optimal instrument, accessories, or software. The different intelligent systems help our partners to develop rapid, reliable, cost-effective, sustainable measurement and control solutions.
![]()
Our goals:
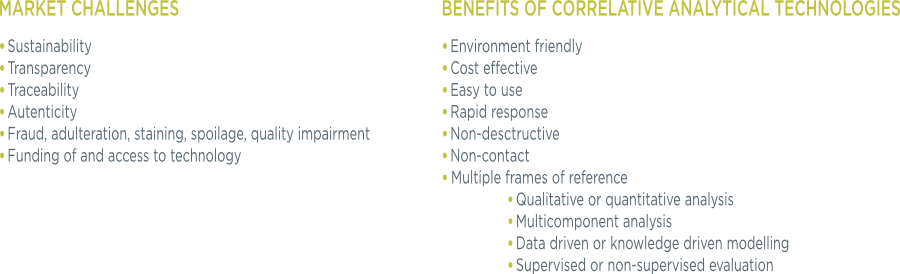
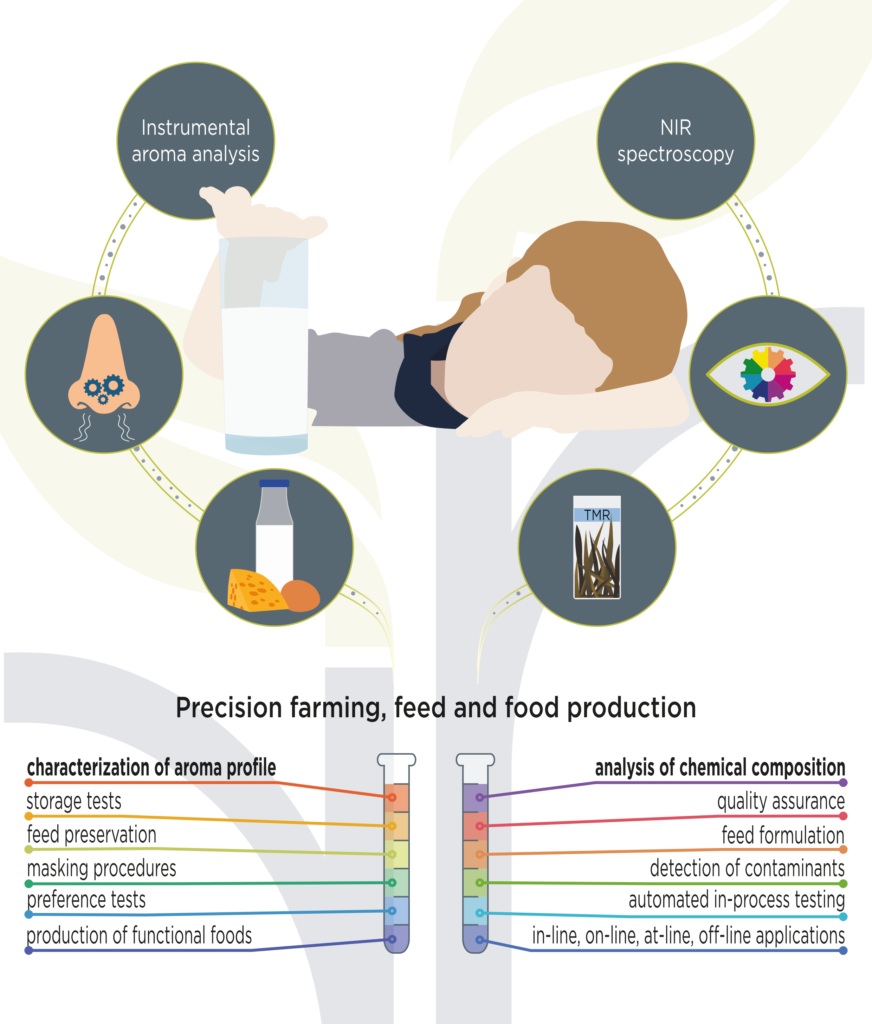
- To develop correlative analytical technologies by combining non-destructive detection methods (e.g. spectroscopy and artificial aroma analysis) and multivariate data analysis.
- To implement fast, reliable, cost-effective, and environmentally friendly analytical solutions that are compatible with the requirements of sustainable agricultural production, precision farming and the modern food industry.
- To increase profitability of partners by assisting with smart applications.
Services:
Technical advisory and support (hardware, software, practice)
In many cases users are unable to take advantage of the technology they invested in. Lack of knowledge about the technology can cause this, as well as unrealized mistakes in certain subtasks. In the field of modern correlative analytical technologies, the Correltech working group of ADEXGO Kft. is at the disposal of the partners within the areas listed below:
- Design, preparation and implementation of new near-infrared spectroscopic (NIRS) calibrations and validations.
- Design and implementation of validations for existing NIRS calibrations, evaluation of calibrations and validations.
- Complex status assessment and analysis of existing NIRS applications, evaluation of individual operations and devices at critical points.
- Repair, maintenance and optimization of existing NIRS calibrations.
- Aroma analysis based on measured odor fingerprint data.
- Demonstration of the possibilities of NIRS and instrumental aroma analysis (electronic nose and tongue techniques) in connection with the partner’s activities.
- Status analysis, planning the implementation of new rapid correlative analytical methods.
- Inspection and maintenance of measuring instruments (if necessary, with the help of the distributor).
- Review and improvement of sampling and measurement processes.
Research, Development, Innovation
Thanks to the extensive range of activities and the many years of professional experience of its employees, ADEXGO is able to actively participate in many R&D tenders, either as a consortium member or as a subcontractor.
Our company is a reliable and scientifically recognized partner, whether it is the production of modern complementary feeds and foods with high added value, or the development of new industrial and physiological testing methods.
Our Correltech working group undertakes research, development and innovation tasks in the field of fast, automated, cost-effective and environmentally friendly technologies and assists the application of the developed methodologies. In the framework of R&D&I projects, we do the development and adaptation of methods for the physical and chemical characterization of feed and food.
Activities of the Correltech division in R&D tenders:
Planning the introduction of correlative methods: Planning the development of new methods for partners already opening up to the field or already using correlative procedures (NIRS, instrumental odor and taste analysis) but also thinking in new applications after a detailed mapping of their activities and needs.
Method development: Research and method development based on NIR spectroscopy and instrumental aroma analysis under laboratory and modeled operating conditions. Comparing practical challenges and technological opportunities. Assisting in technological developments, selecting and installing new hardware and software for a specific purpose, developing calibrations.
Development of customized and/or programmable data analysis applications: Using miniaturized tools, develop handheld devices and software that allow skilled users to perform rapid measurements under field conditions and get immediate results for the samples tested based on an internal database. Similarly, taking into account the applicability directions defined during the method development, the use of miniaturized tools and special software e.g. for automated process control/management in a manufacturing plant.
Database construction, management: Designing databases required for setting up and validating various qualitative and quantitative models, coordinating data collection, database management, data protection.
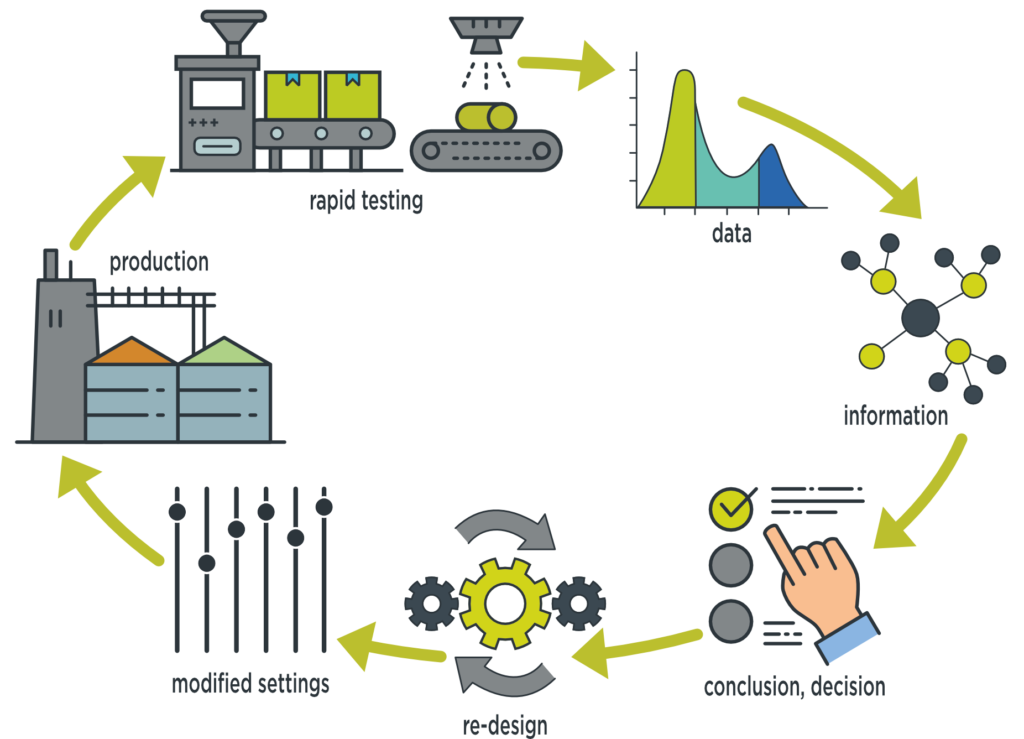
Complex wine testing with correlative rapid analytical technologies
As the result of our development in the past few years, in the framework of an international EUREKA tender, we have developed a technology with which the near-infrared spectrum describing the composition of the wine, as well as the aroma profile describing its smell and taste, can be measured objectively, similarly to human sensory tests.
Contact us with confidence:
We are happy to assist in the careful compilation of experimental plans tailored to individual cases. You can find a more detailed description of the individual technologies on the Correltech site in the Topics section, and we are available to all interested parties with more information on our contact details.
Technology and methodology:
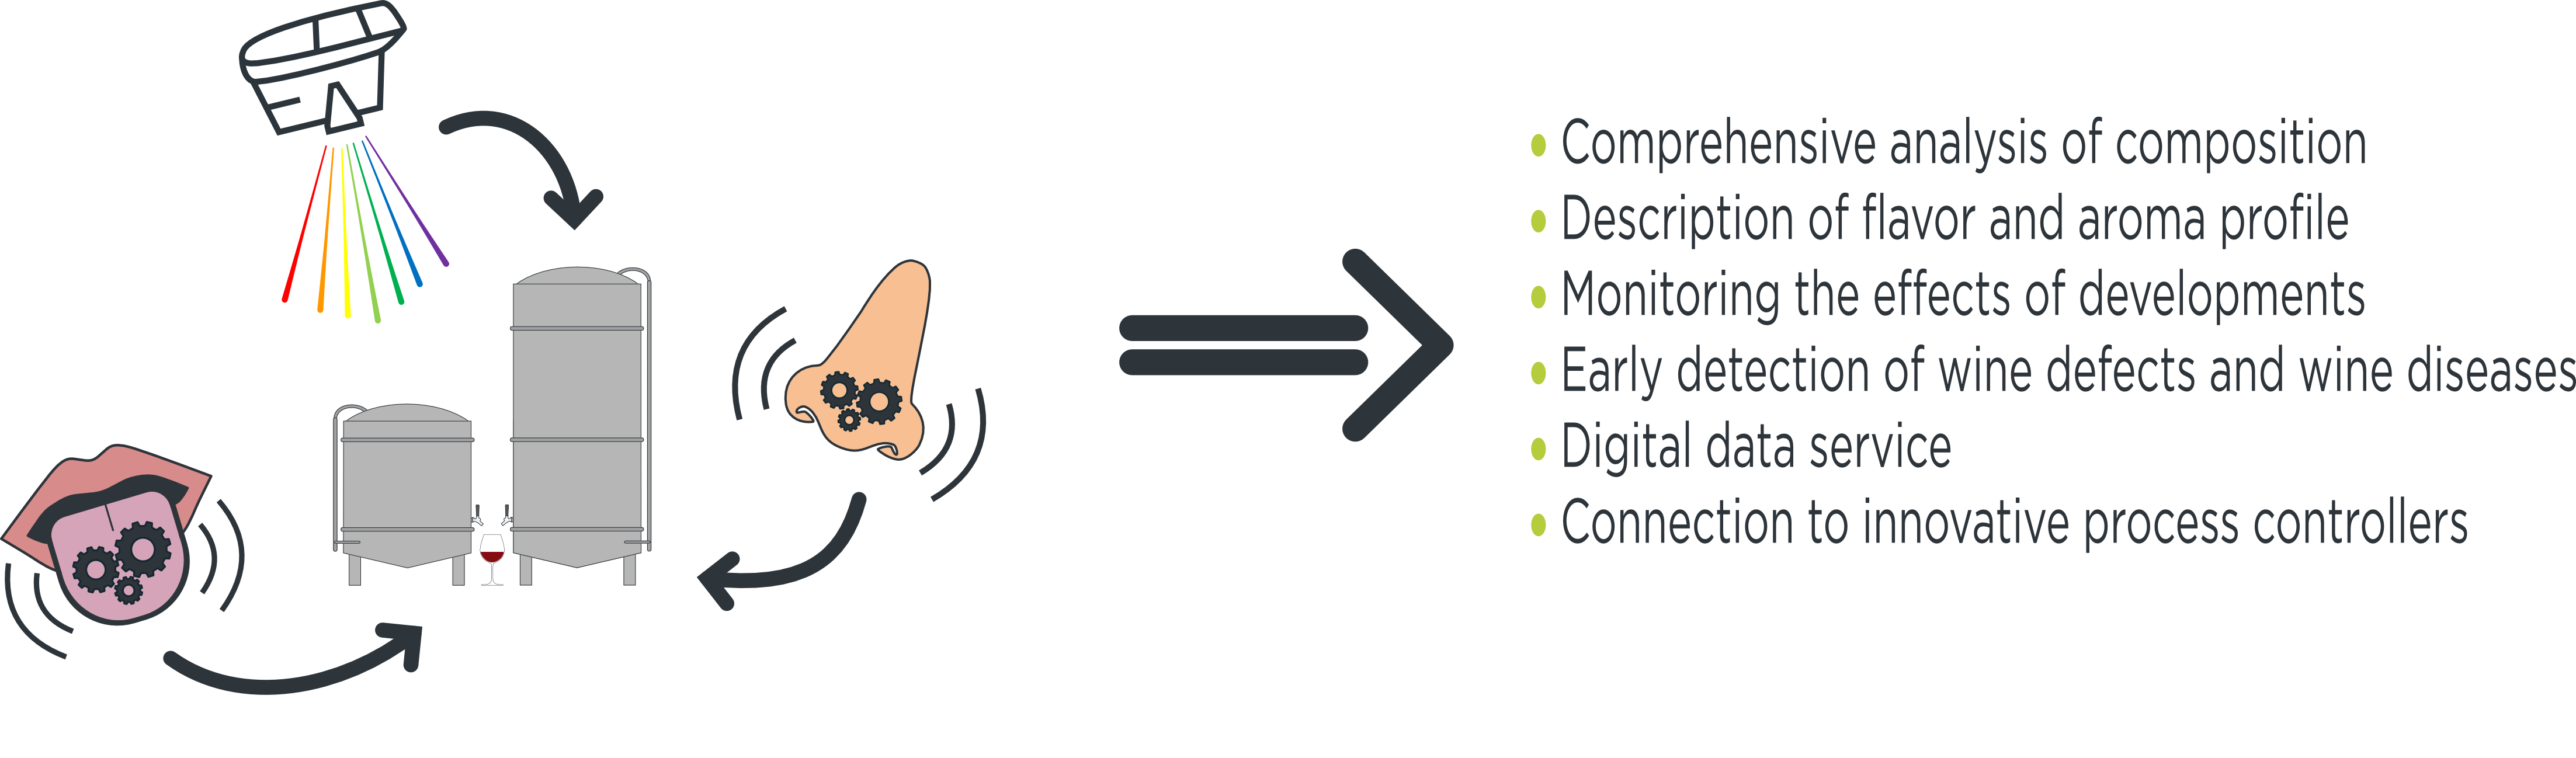
During the tests, we combine three instrumental rapid analytical technologies: the near-infrared (NIR) spectra of the wines are recorded and analyzed, and in parallel, we perform instrumental sensory tests with the so-called electronic nose and electronic tongue technologies.
- The NIR spectra carry information about the composition of the wines, from which – using the data analysis methods developed by our team – we can deduce the quality and the presence and ratio of certain chemical components.
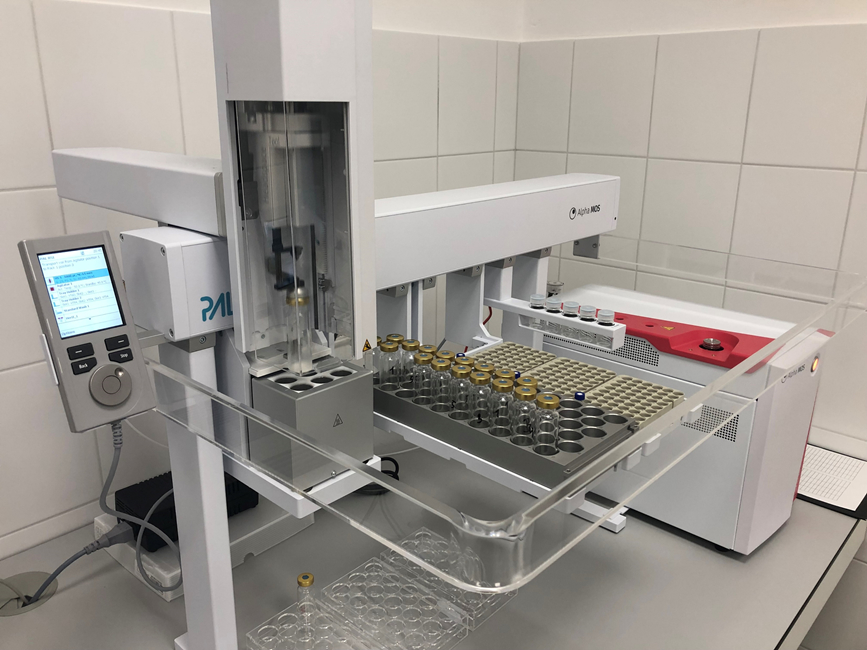
- Electronic nose tests are preceded by special sample preparation, which reduces the solubility of the wine’s volatile components. The volatile substances released in this way appear in greater concentration in the headspace formed above the wine. After that, we take a scent sample from the closed, saturated headspace, which is analyzed with equipment based on gas chromatography separation technology. During the analysis of the recorded individual volatile profiles, we determine the aroma characteristics and describe the similarities and differences between the samples.
- For the electronic tongue tests, the wines are diluted with water, and then the signals generated by the flavors are measured on the sensors covered with different biological membranes and immersed in the solution. During the analysis of the recorded individual taste profiles, we determine the aroma characteristics and describe the similarities and differences between the samples.
The test sequence carried out using the above methodology takes only a few minutes per sample, therefore, the results can be announced shortly after arrival at the laboratory, depending on the number of samples.
Advantages of the methodology:
- Holistic tests: non-targeted analytical technologies that create different imprints of the overall image of the tested materials (spectroscopic, scent, taste imprints), which can change due to changes in any component or physical condition. Due to this, unexpected changes can be effectively detected with this holistic testing methodology.
- Targeted detection and quantification of certain components: the presence and quantity of certain components (organic acids, defined fragrances) can be measured during instrumental sensory tests.
- Versatile analysis: we provide a comprehensive picture of the tested samples through the description of the optical signals, the smell and the taste.
- Objective picture: the repeatability of the measurements is exceptionally good, the measured imprints objectively represent the given samples, the data analysis gives an authentic picture of the individual samples, the relationships within and between the sample groups.
- Long-term comparison: the archived digital imprints can be compared over a period of years, and it is also possible to compare geographically distant products.
- Minimal sample preparation: the sample preparation prior to the tests is no more than filling into the specific sample holders.
- Green technology: we do not use organic solvents for the tests, the use of technological chemicals and thus the associated pollutant load is minimal.
- Hazard-tolerant application: it can even be used in places and environments where (and substances can be tested on which) human testing would not be feasible.
- Frequent measurement: in the case of NIR tests, measurements can be made every minute, in the case of instrumental sensory tests, the time between measurements is a few minutes.
- Quick results: in addition to the measurements, data processing and result communication can also be done rapidly, helping quick decision making.
- Digital data: the resulting digital data can be used well during archiving processes, objective comparisons, and can provide information for various automated management systems.
- Industry 4.0 compatibility: by developing local applications, we can provide connectivity to various Industry 4.0 systems.
- Cost-effectiveness: considering the vast amount of data, the density, frequency, variety and usefulness of the extracted information recorded from the samples, the methodology is highly cost-effective compared to targeted chemical analyses or sensory panel tests.
Related services:
Depending on the experimental plan, it may be necessary to calibrate and validate the instrumental rapid analytical methods with classical examination of the samples. It is possible to carry out the following reference tests in our partner laboratories.
- Analytical tests (targeted determination of certain components using classic analytical methods)
- Physical tests (CIE Lab color and viscosity measurement)
- Microbiological tests
- Human sensory studies with laic panel
- Human sensory evaluations with professional tasters
To whom do we recommend our complex rapid analytical technology?
- For companies and institutions conducting innovative oenological research, where it is essential to have comprehensive, objective data about wines that can be easily interpreted digitally.
- For classic wineries, where it is important to describe the uniqueness in an objective way, as well as to continuously monitor the quality over the years. We especially recommend it to winemakers who produce terroir-type (local) wines and select and use autochthonous yeast strains.
- Regardless of the tested substance, for those who manufacture, distribute or use products with complex composition and production technology. The multi-faceted approach of this testing methodology is capable of detecting unexpected changes. In contrast to targeted analytical tests, it can be used excellently for overall monitoring of production and processing, for the effective detection of errors and changes in products.
Topics:
Near-infrared Spectroscopy (NIRS)
Near-infrared (NIR) spectroscopy is based on the interaction of light (near-infrared photons, electromagnetic radiation) and the sample. The NIR spectrum is the result of the absorption of C–H, O–H, N–H, and S–H bonds of organic molecules at different wavelengths, but can also be influenced by a number of other factors (e.g., particle size, temperature, compaction). Almost all the major components that make up agricultural products have absorption bands in the NIR range (800–2500 nm), making this wavelength range particularly suitable for characterizing product quality.
The advantage of the technique is that the optical properties can be measured essentially independently of the material type, quickly and without destruction. With one instrument, many independent characteristics can be measured at the same time, be it a chemical component or a physical property.
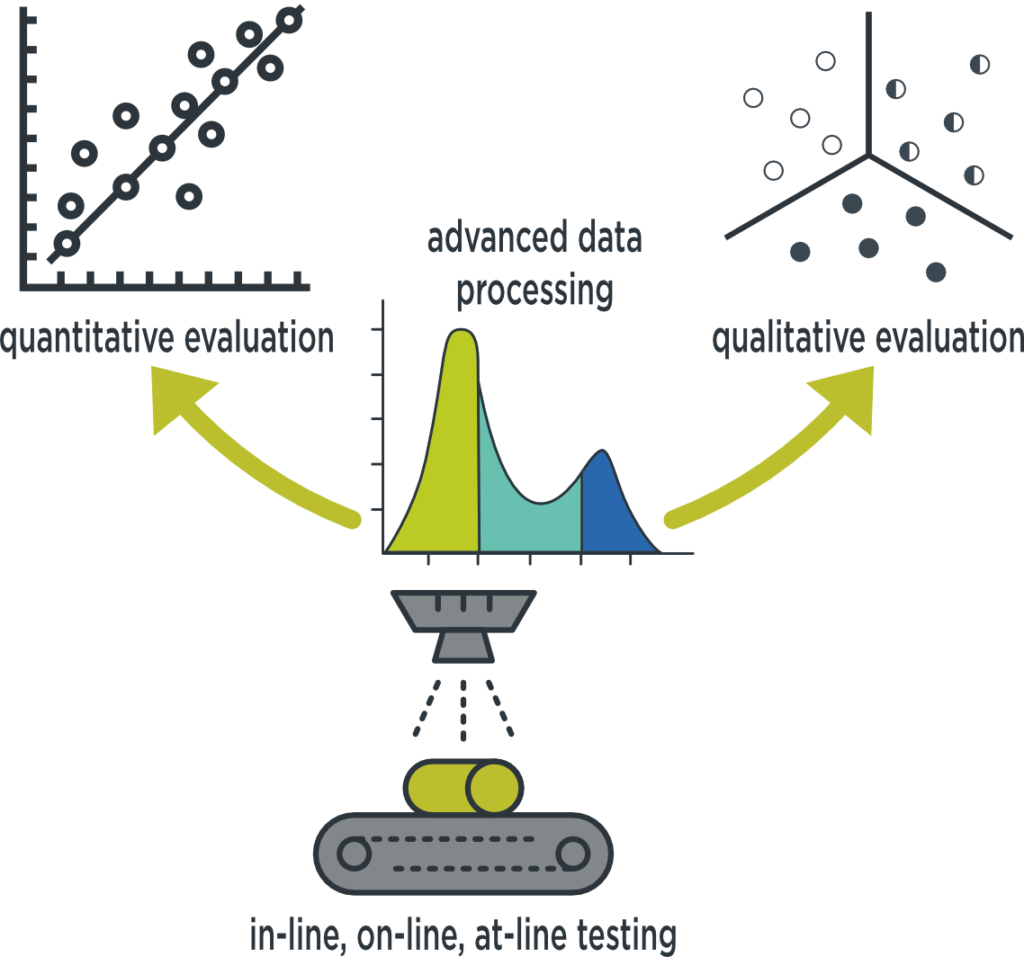
The NIRS method is suitable for both qualitative (e.g. separation of types, quality groups) and quantitative (e.g. quantification of a chemical component, estimation of physical parameters). In the latter case, in addition to the spectra, we also need the reference data (e.g. the results of chemical laboratory measurements), and after exploring the correlations between the spectrum and the reference database, it is possible to estimate the given parameters for independent samples based on their NIR spectra solely. NIRS is thus basically a correlative technique, its estimation accuracy depends on the reference method used, the recorded NIR data, and the quality of the calibration.
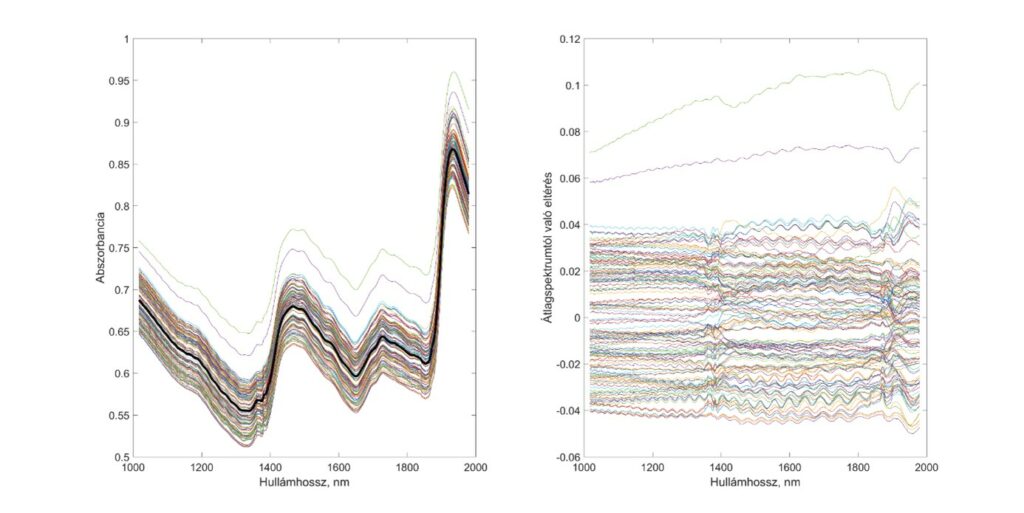
Identification of spectral defects originating from the faulty operation of a spectrometer
The NIR spectrum of most agricultural products is complex due to the overlaps of the absorption bands of the components and the blurring of the absorption peaks. Mathematical statistical methods, including the transformation of the original spectra, should be used to quantify each component. Users can choose from a variety of software that includes various multivariate mathematical methods to explore the relationships between spectra and certain properties of the test substance.
It should be emphasized that very accurate calibrations can be performed with the available mathematical-statistical methods and software background. It is not uncommon for models based on NIR spectra to describe the variance of reference variables almost entirely. Some studies compare the reliability of NIR tests and calibrations with the reliability of laboratory reference measurements, noting that the most limiting factor in NIRS estimates is the laboratory reference data on which the calibrations are based: the NIR spectroscopic estimation may theoretically perform better than the reference method for certain parameters.
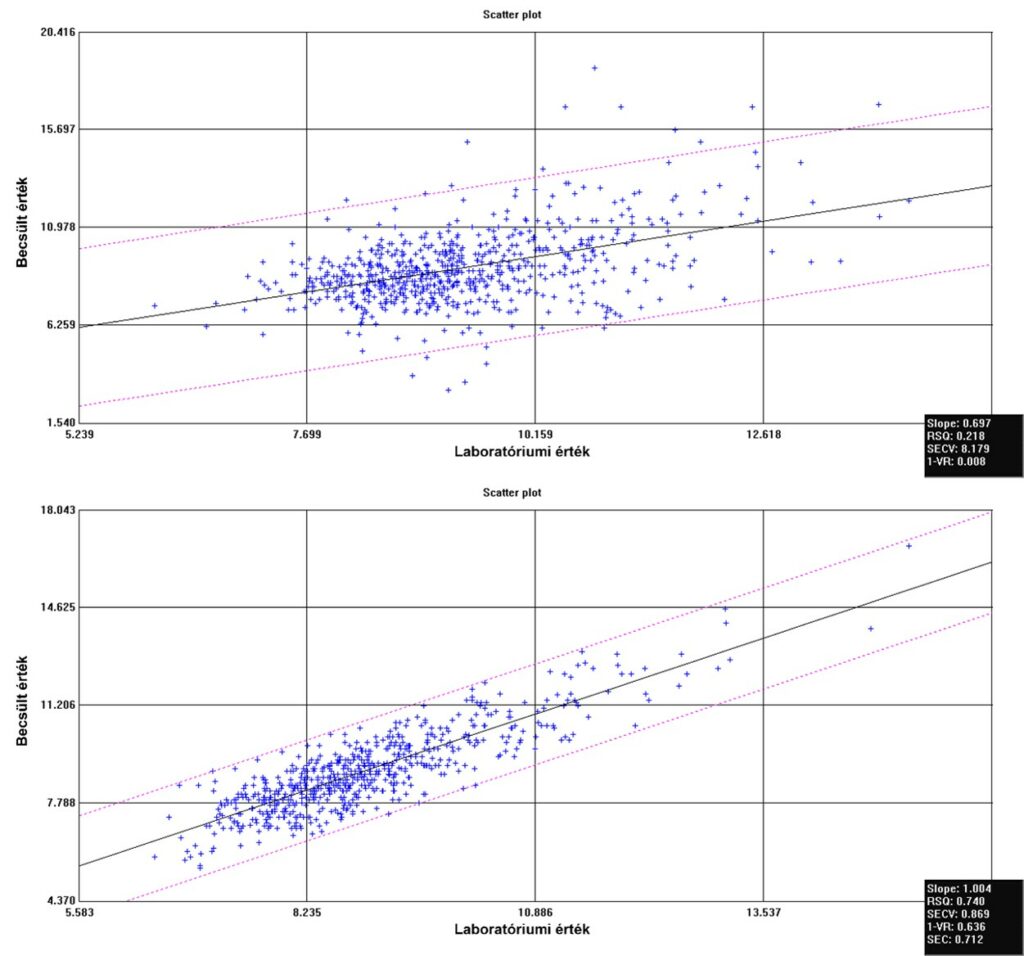
Comparision of the originally used, and the improved quantitative models (R² = 0.218; improved R² = 0.740) – applied corrections: outlier selection in spectral and reference data, spectrum pretreatment, wavelength optimization, optimization of regression
Recently, there is a growing need to set up more and more perfect NIRS methods for quality classification. This can be partly explained by the fact that the customers of certain products have little interest in the exact composition values, but they are curious as to whether the given product fits into a system of expectations, product group (e.g. organic products). Accordingly, for qualitative analyzes, the separation and discrimination of the sample groups are examined based on the spectral data.
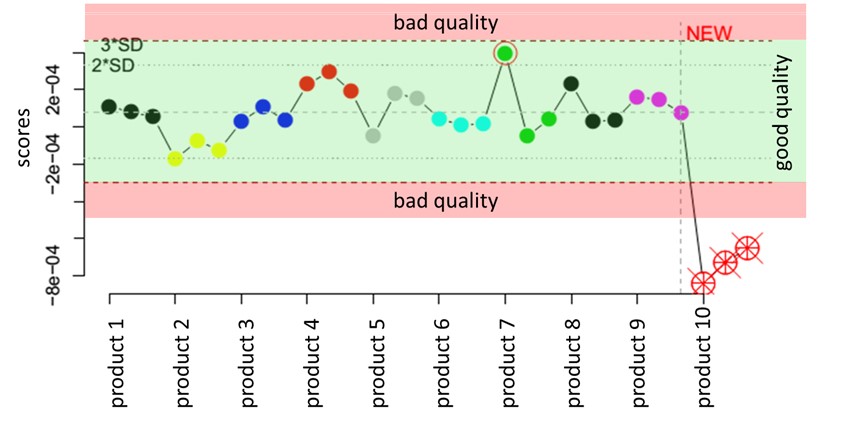
Quality control and warning system to easily recognize faulty production, unsound input or output products
The method is excellent for monitoring processes and making quick decisions, especially in cases where the laboratory reference measurement can take day, instead of the reliable rapid NIRS predictions. In contrast to traditional chemical tests, this rapid correlative analytical method does not require a highly skilled workforce for routine measurements, no reagents and solvents are required, thus reducing the cost of analysis and the burden on the environment. One measurement can provide information on several attributes, and even non-targeted analyses (complex quality assessments) can be performed to detect unforeseen anomalies (this approach is not possible in classical analytical chemistry where always certain components are targeted, instead of taking a holistic imprint, measuring uniformly the status of the sample).
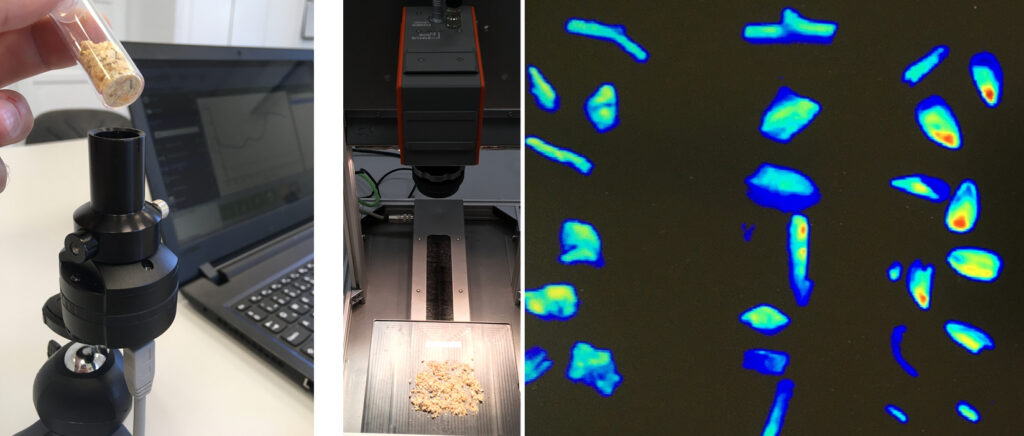
As a result of technological advances in recent years, not only has computing capacity increased, but there has also been a significant miniaturization of instruments. High measurement accuracy is still represented by the traditional NIR (dispersive monochromator) and FT-NIR (interferometer) devices in the desktop version, which can be used in practical, operational conditions with a robust design or fiber optics. However, due to various technological innovations (e.g. micro-electromechanical systems, MEMS), an increasing number of small-scale manual or in-process spectrometers are appearing on the market, which can compete with classical equipment in terms of value for money and applications. A special type of NIR spectroscopy is hyperspectral imaging, which allows the capture of a complete spectroscopic map of planar patterns, provided that the spectra can be measured on a pixel-by-pixel basis, allowing macroscopically heterogeneous systems to be examined at the component level.
You can find our articles on this topic on the Publications page.
Artificial aroma analysis (instrumental odor and taste sensing, electronic nose, electronic tongue)
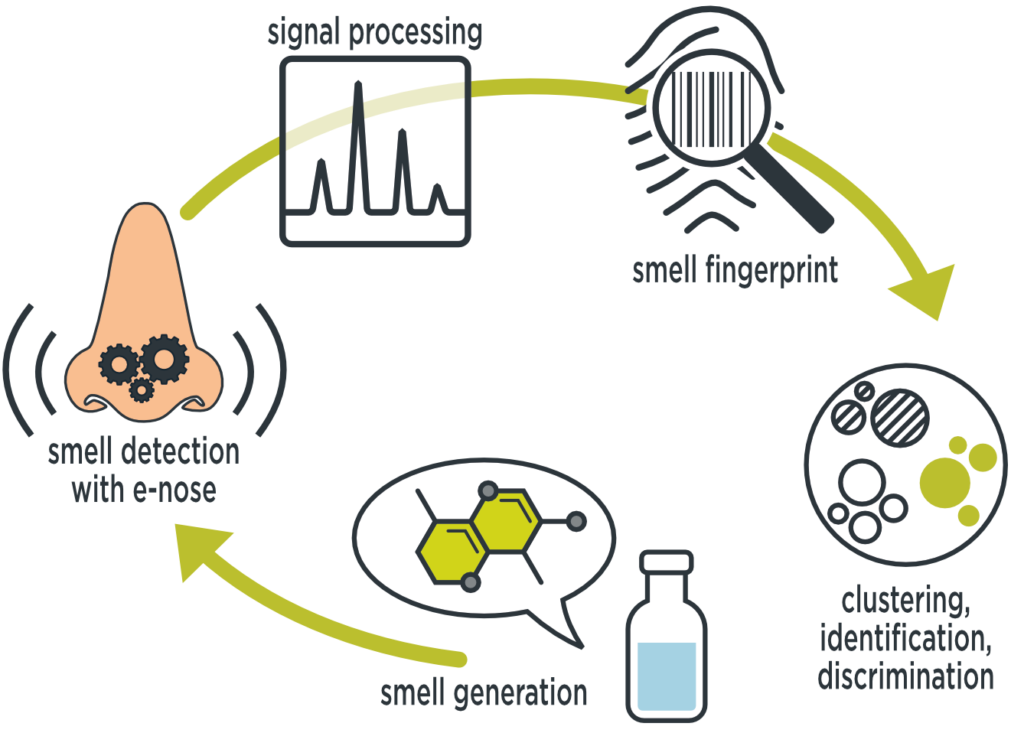
Electronic nose devices are analytical devices used to measure volatile components. A sample of the headspace formed around solid, liquid or gaseous products is analyzed by identifying the molecules in the vapor using a separation technique and quantifying the volatiles.
The obtained aroma profile describes the nature of the volatile molecules characteristic of the samples and their dominance. For flavors, sensors with special membranes sensitive to different flavors are immersed into liquid or liquified samples. The change in resistance measured on the sensors as a result of each taste causing substance describes the taste profile of the sample.
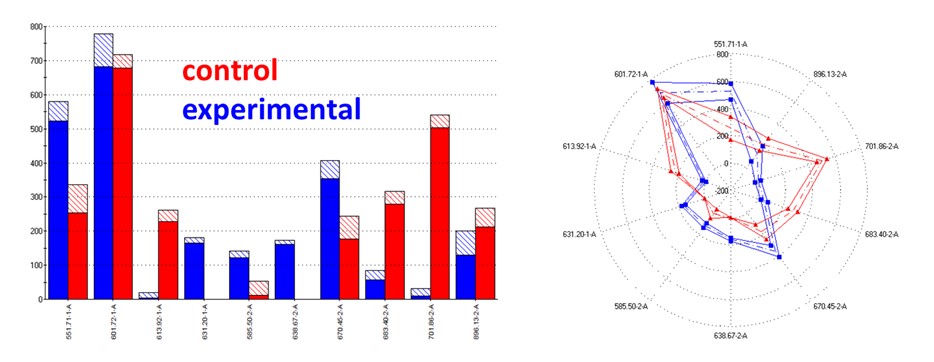
Evaluation of the effect of treatments causing aroma modification, and the identification of the aroma components causing the differences
E-nose devices operating on different principles are generally able to detect changes in the chemical composition in the gas phase, as a result of which they are suitable for measuring odors. In many practical applications, it is not the measurement of the odor that can be perceived by the human nose that is important, but the measurement of other molecules that do not produce a direct odor or defining sensation.
It is important to emphasize the advantage of e-nose devices over biological sensing, as the identity or difference of the aroma profiles can be objectively and quantitatively verified. Therefore, this technology can be an effective tool in the development of quality systems based on the presence of volatile components, where previously only subjective judgment could be relied upon.
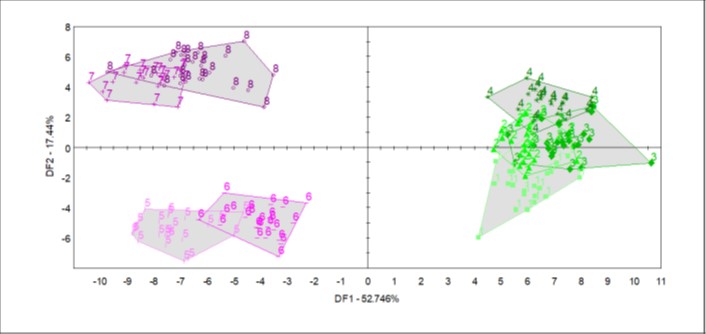
Multivariate classifications of sample groups to identify effect of treatment, odor-based differences or similarities of groups
In the case of complex aroma profiles, even this technology is often unable to accurately identify and quantify individual volatile compounds, but there are many applications where accurate knowledge and individual measurement of the compounds is not required, but deciding the complex acceptability is the task. In such situations, the technology described above can be used as an warning system. In the case of the detection of inappropriate aroma profiles, other alternative test pathways may provide answers to more detailed questions.
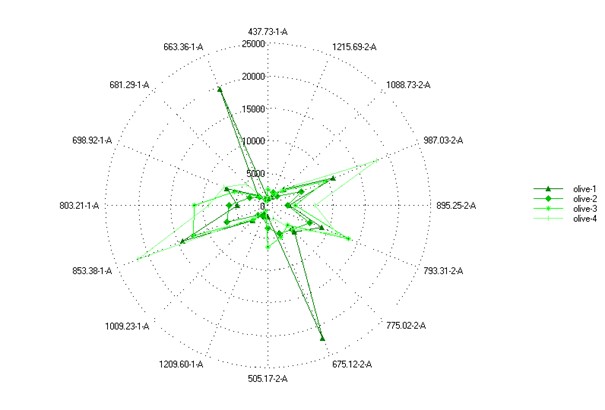
Description of differences/similarities of products with a spider-plot based on e-nose sensor data that helps to identify the aromatic variations
Multivariate data analysis methods are used to compare and identify instrumentally measured odor profiles. The results can be compared with the results of human sensory panel tests and preference tests.
The advantages of this method are that
- it provides objective, stable measurement data in contrast to human or animal sensory tests,
- much more sensitive to many volatile substances than human or animal test subjects,
- these are measurements that can be performed on a large number of samples, even continuously, which can also provide data for automated systems.
Knowing the odor characteristics of each sample makes it possible, inter alia, to:
- create an aroma pattern specific to one product in other products as well,
- cover unwanted odors with other odors,
- to record the characteristic odor of the product, to keep it stable by means of process control devices or to use it for quality and origin control purposes,
- replace costly, time-consuming, and strictly regulated human or animal preference tests.
You can find our articles on this topic on the Publications page.
Multivariate data analysis (Chemometrics)
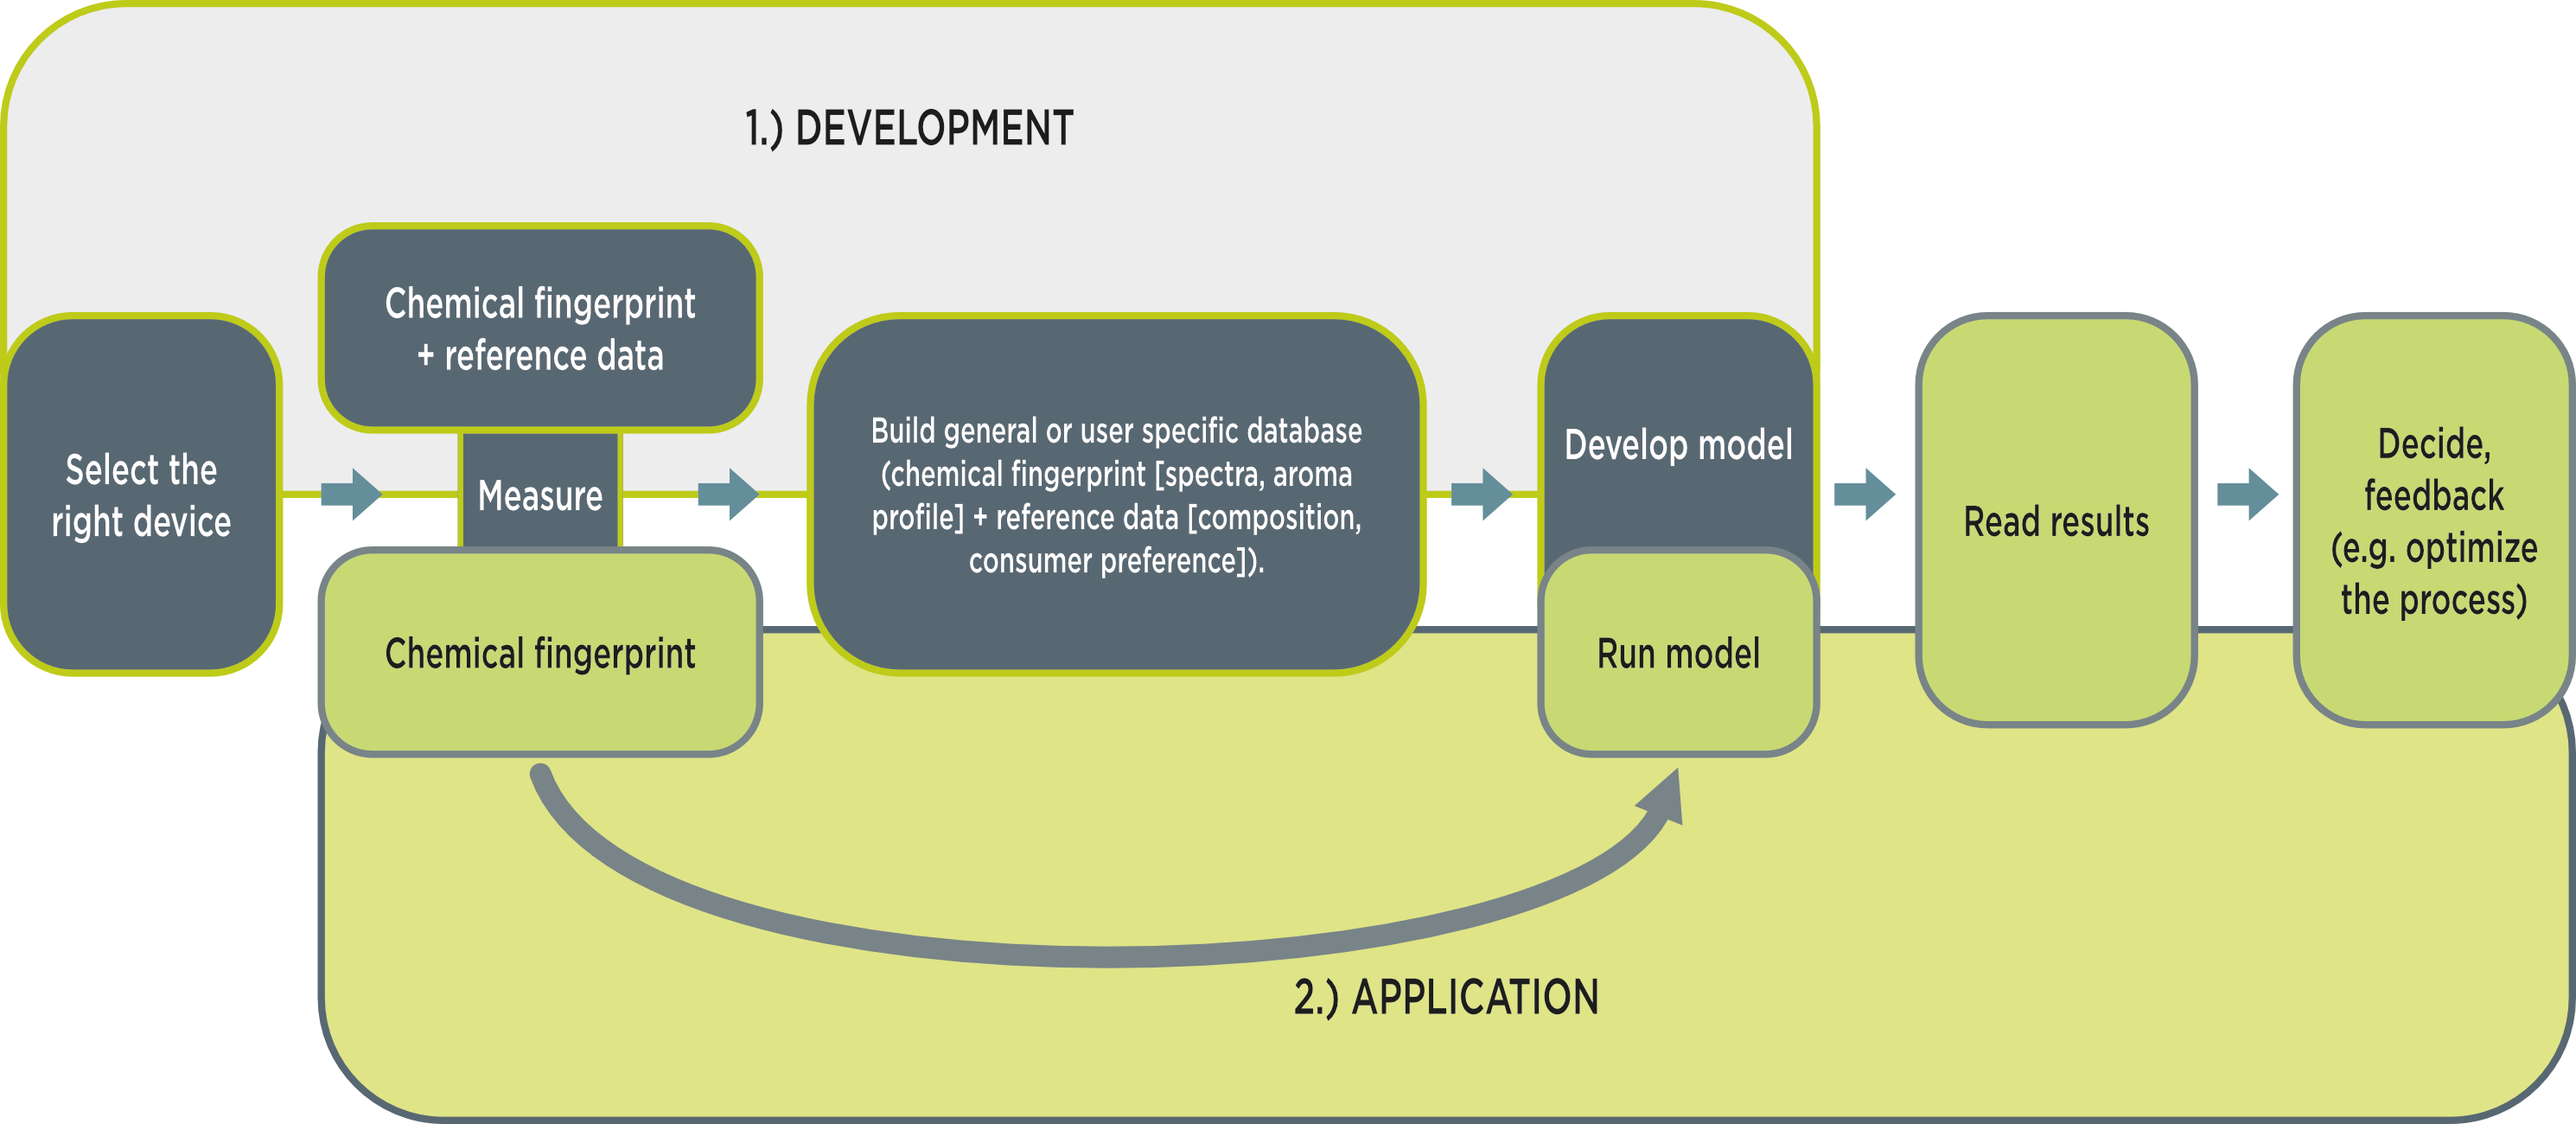
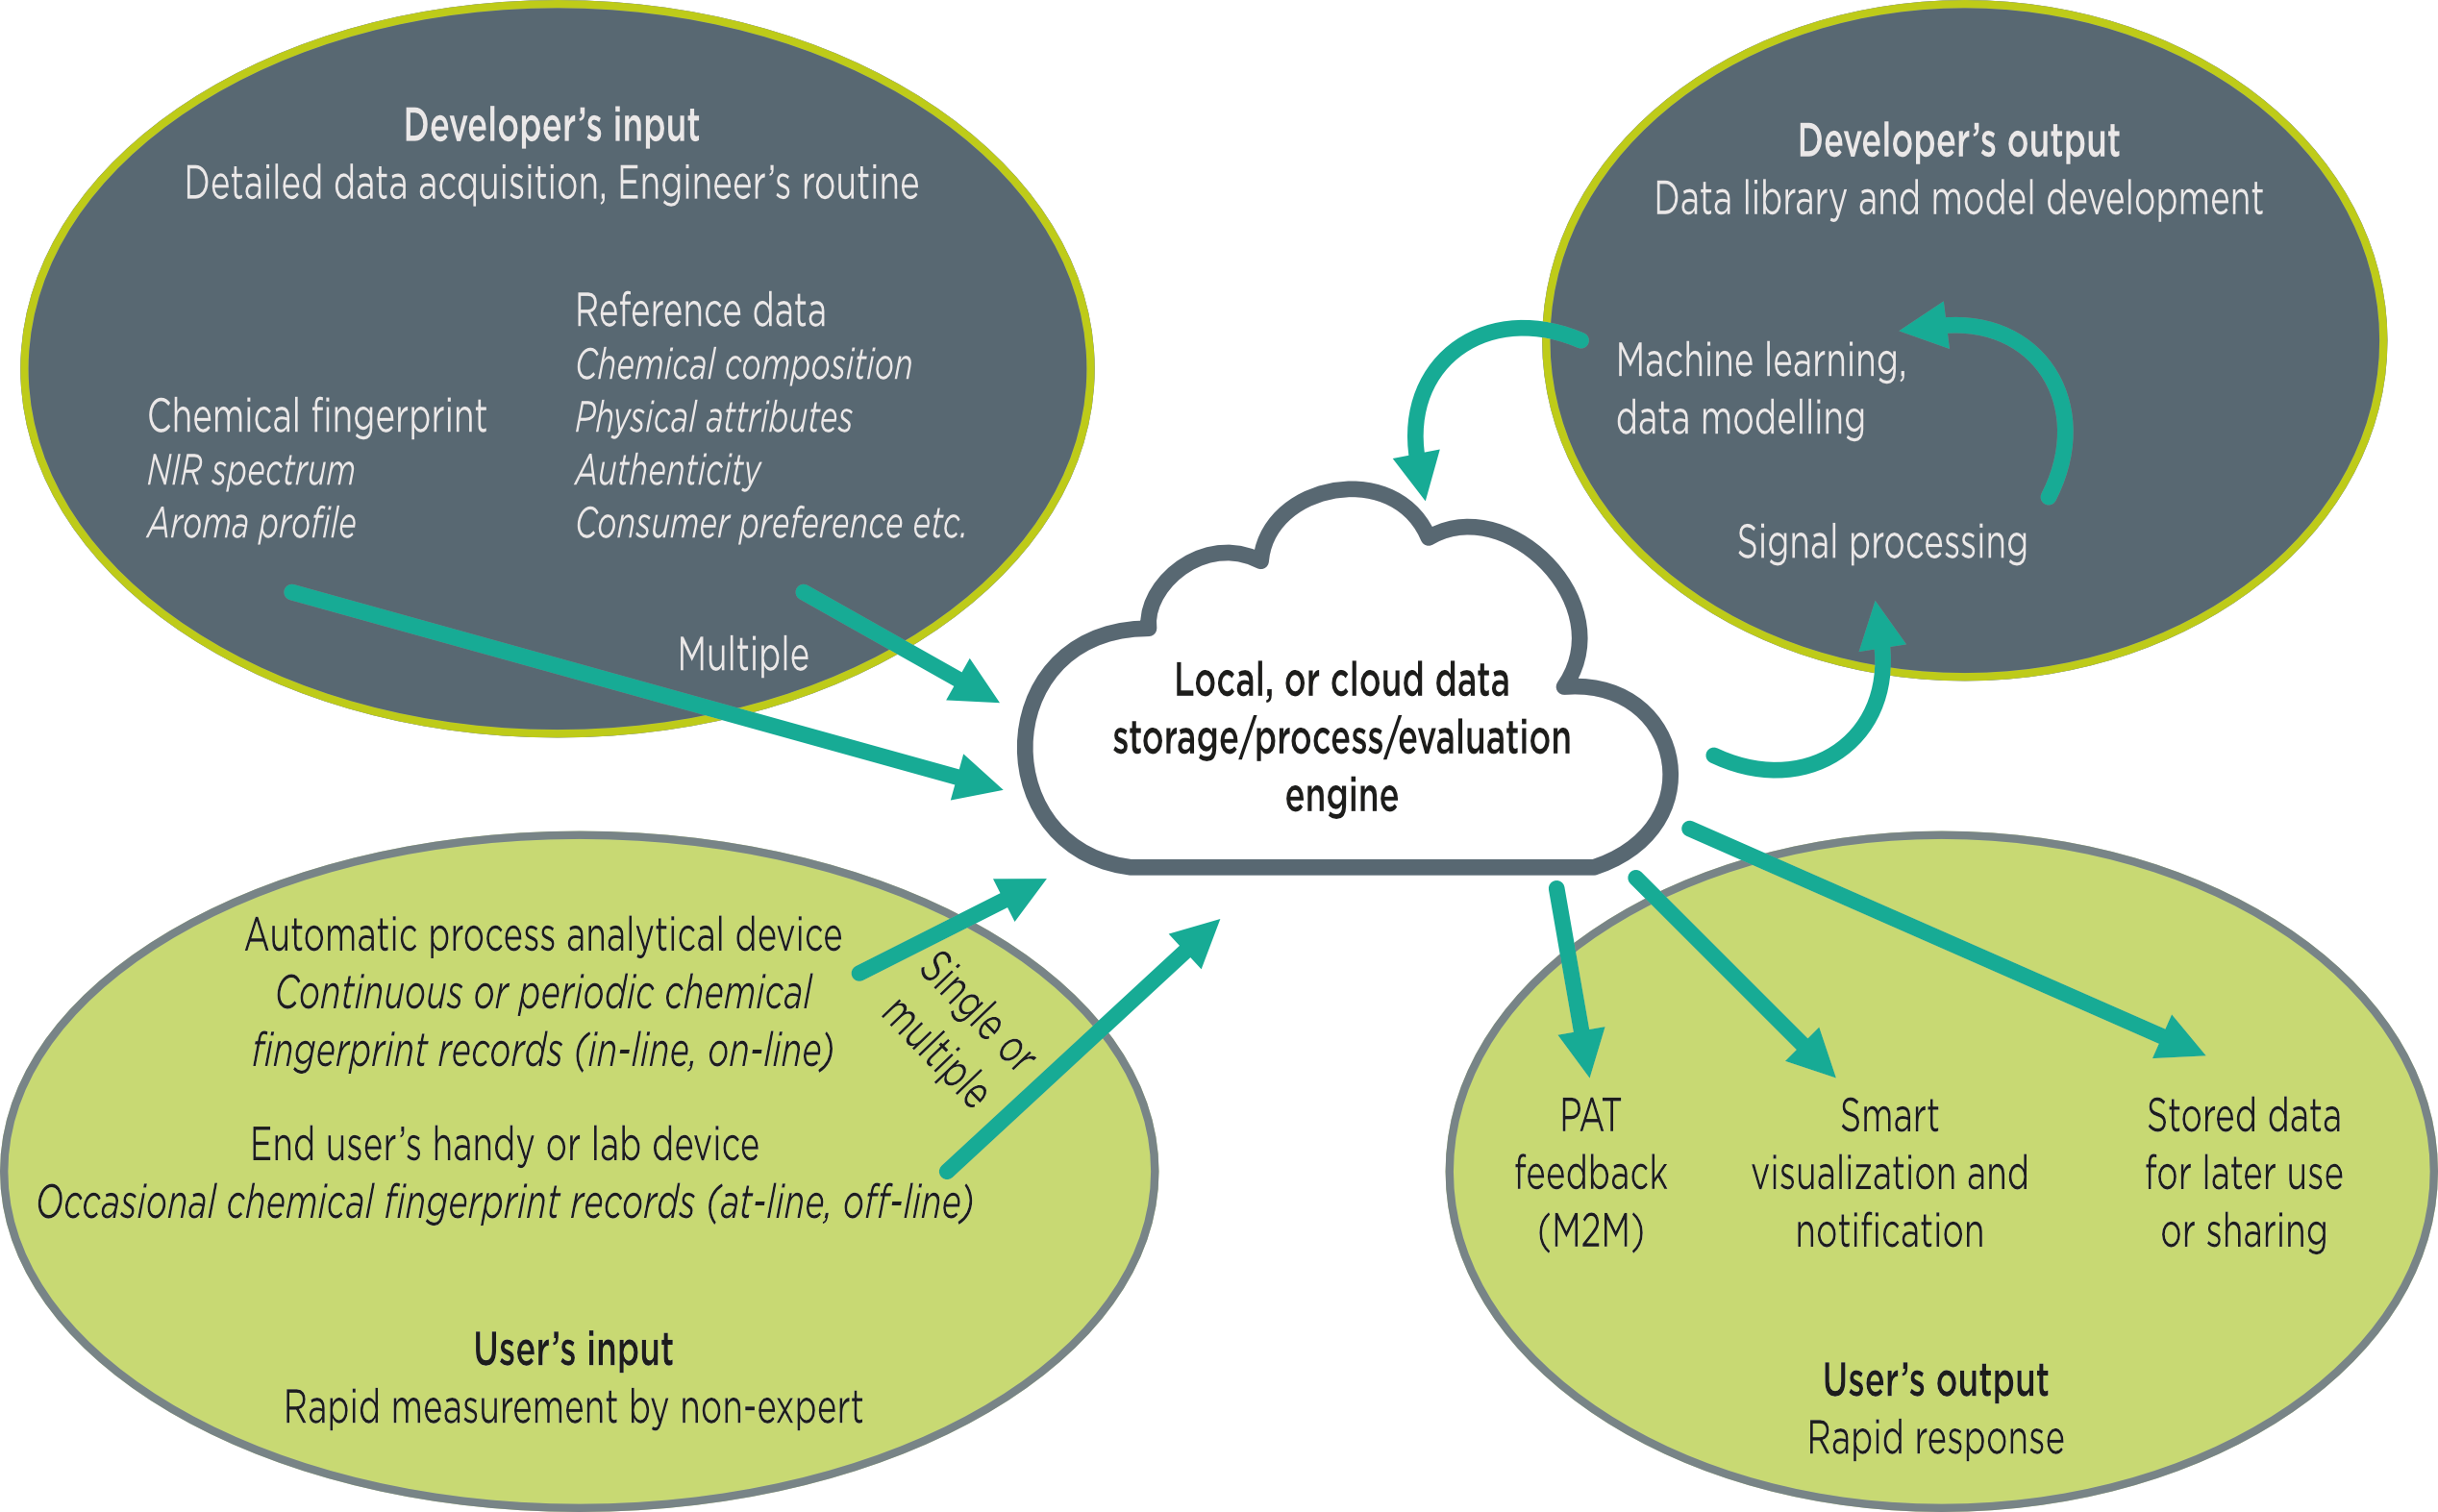
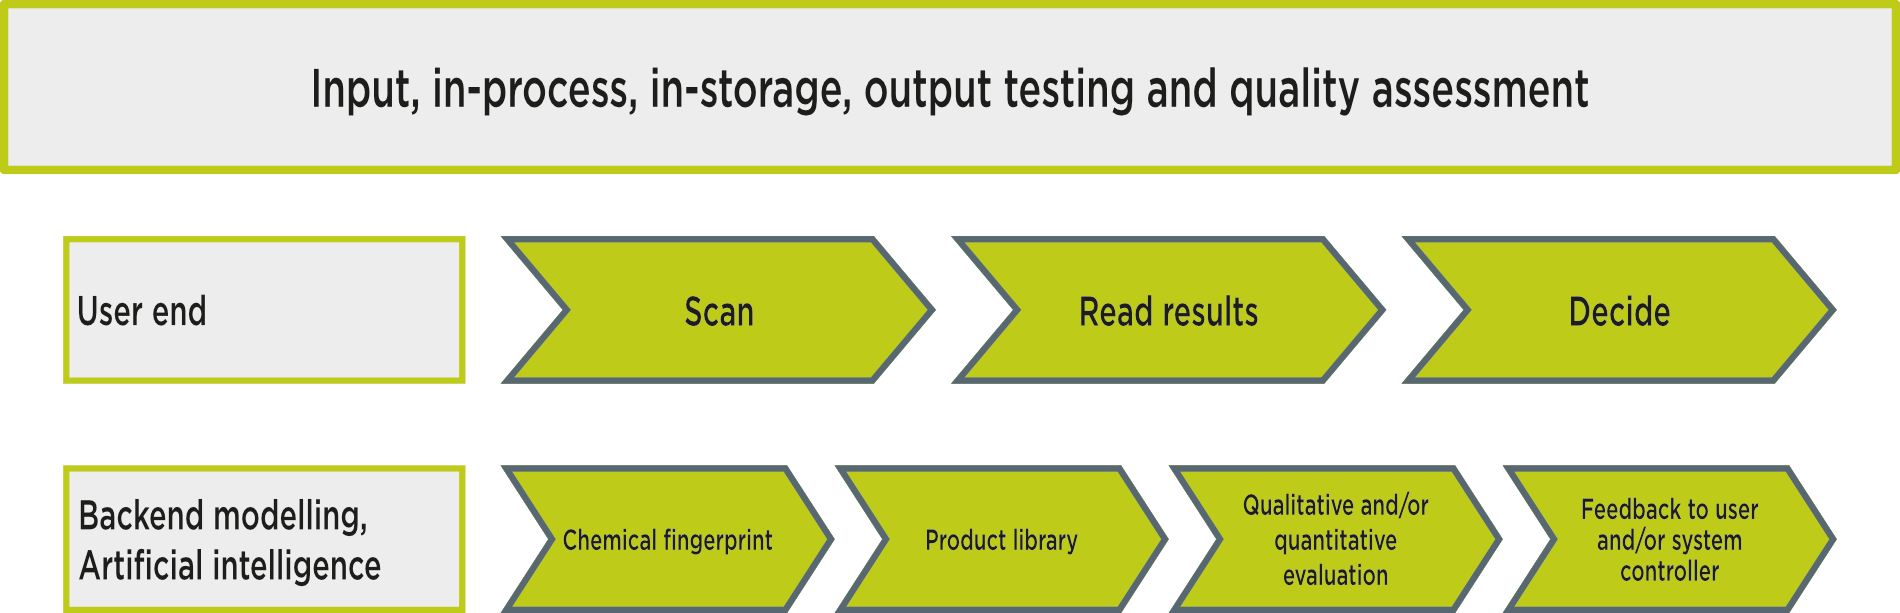
In the correlative analysis related to modern instrumental rapid test methods, computer processing must be performed to evaluate and interpret the comprehensive, typically huge data set recorded with each technique, and to explore the relevant results. The first step in these methodologies is to train the system. In doing so, we compare the results of rapid tests (e.g. NIR spectra) with the available and later intended reference data (e.g. chemical composition) to mathematically explore the relationships (calculate equations for determination). With the help of the developed correlative models, the parameter to be measured can be estimated directly from the signals of the rapid test without the need for classical analytical measurements. Consequently, chemometric processing aims to understand the relationship between certain characteristics of the samples and the measured values of the rapid test methods, based on chemical information. This complex model development includes expert sampling, preparation of a measurement plan, execution of measurements (using both reference and rapid test methods), exploration of the relationships between the data collected, and practical application of rapid analytical methods based on the extracted knowledge. Extensive programming, mathematical, statistical, chemical, physical, and biological knowledge is required to perform this work to a high standard.
What is correlative analytics?
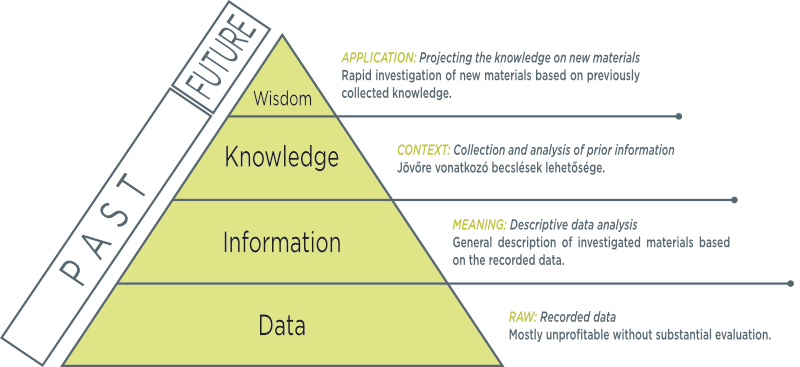
In knowledge-driven classical chemical analytics, we draw conclusions about hypotheses from the measurement of the few properties of a well-chosen sample with a small number of elements. In contrast, in data-driven correlative analysis, we examine a large number of sample items, collect a significant amount of data by measuring several properties, and then evaluate the multivariate data and draw exploratory conclusions. Through comprehensive experience based on a large number of items, we make correlative findings that allow us to make high-value decisions from the simple and fast measurement results of new samples.
What is multivariate data?
Multivariate data is data resulting from the measurement of several related or independent properties. In the application of various instrumental rapid an analytical techniques, such multi-channel data are usually produced, which provide indirect information in a short time, not for a single parameter, but for the comprehensive characterization of the samples. Individual analysis of multivariate data for a single sample is usually difficult or at least seldom expedient, as understanding the properties of the samples and the regularities between multivariate measurement results requires more observation, but for a large number of items, data analysis can be performed using special methods. In multivariate data analysis, complex data are processed in such a way that the number of variables is radically reduced by mathematical transformations, but the sample-specific information described by the original variables is retained as much as possible throughout the process. As a result of data reduction and information concentration, we generate some highly informative new (derived) variables from the dozens or even thousands of variables originally measured, which can later be compared with reference data, such as sample-specific chemical data or class-identifying variables. These multivariate models for qualitative and/or quantitative determinations form the basis for the practical use of rapid analytical techniques.
What are multivariate models good for?
The multivariate models describe the transformations of the original variables measured by the rapid analytical technique, as well as the relationship and correlative characteristics of the derived variables and reference data. These models can be interpreted as experience and provide an opportunity to draw conclusions (e.g. to determine content or group identity) from multivariate data (e.g. spectra) of a new sample that is recorded by the same rapid analytical method.
Does anything become measurable with the models?
It is important that experience and expectation are in line. In this sense, it is advisable to apply the model to a sample similar to the ones known by the model, and the multivariate data and the reference data must be of the same quality in the model and in use: for example, only similar NIR data can be evaluated with NIR spectroscopic model; or a model calibrated for protein and fat content can only infer the two components, no results can be expected from the model for other parameters.
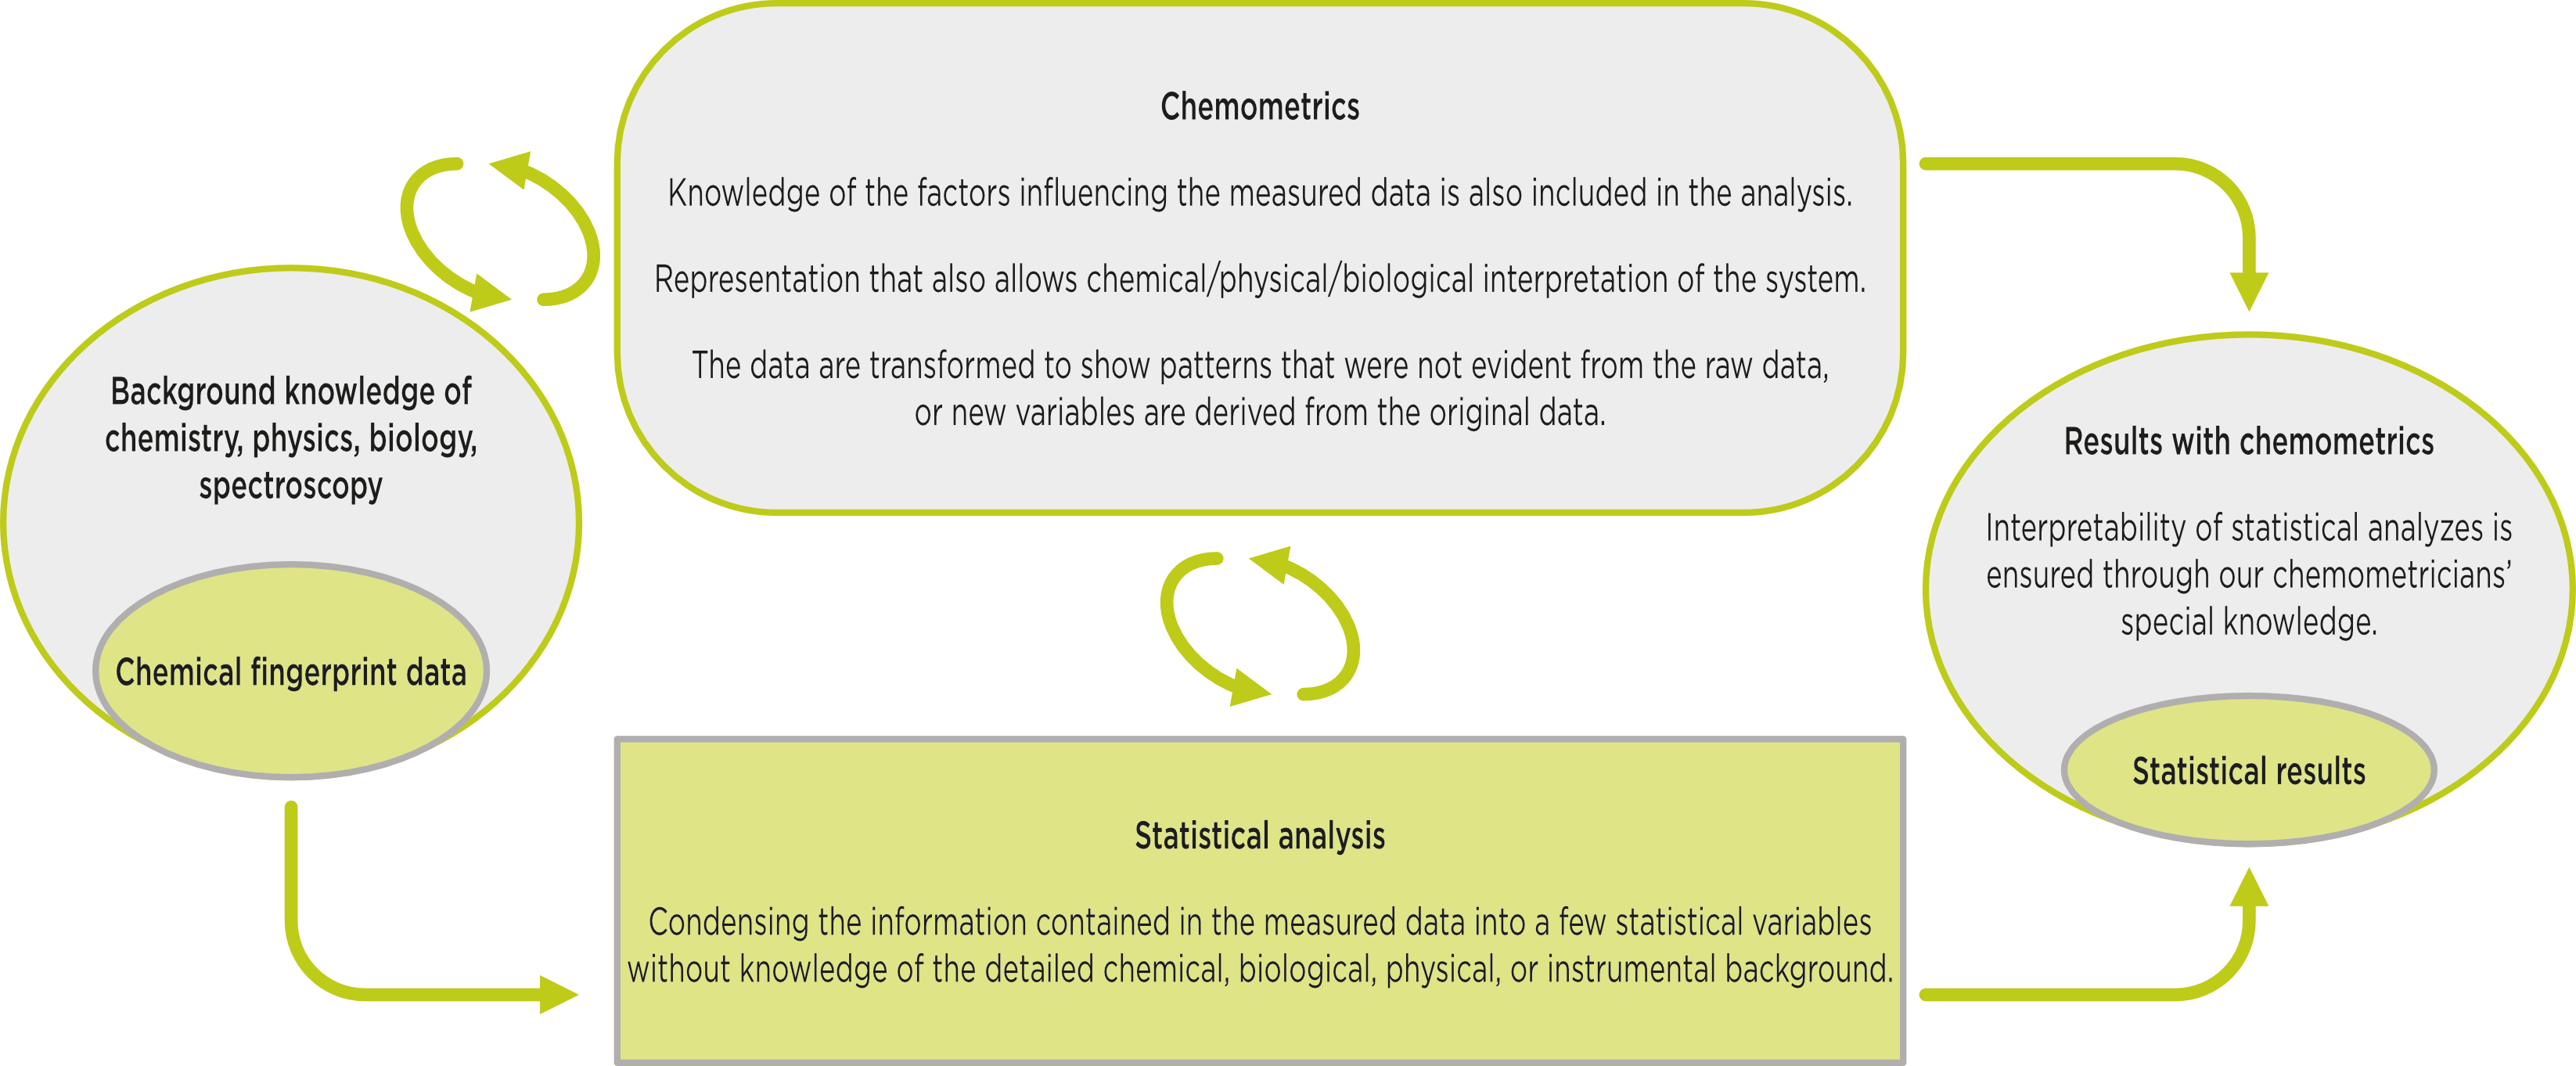
What is chemometrics?
Chemometrics related to multivariate data analysis aims to describe the causal relationships between chemical composition and data from rapid analytical methods. In doing so, we look for chemically explainable information in mathematical transformations and modelling that contributes to the rapid analysis. In many cases, this procedure also helps to reveal indirect relationships, and provides an opportunity to tune the calibrations to expectations and make them more robust.
How can the models be checked?
The wide applicability (robustness) of the models can be checked by validation and estimation of samples with known reference data. The models developed as described above estimate the quantitative (e.g. chemical composition) and/or qualitative (e.g. class of origin) parameters of the new samples and then compare them with reference data (e.g. laboratory-determined chemical composition or known origin) and examine the extent of the estimation error experienced. This gives a good approximation of what error we will experience in the estimates in the future. The extent of the error throughout depends on a number of conditions that must be taken into account and controlled during use as much as we do when making models. Careful selection of these conditions significantly improves the reliability of the results obtained.
You can find our articles on this topic on the Publications page.
Examples of applications:
- Sample composition and quality assurance with NIR camera either on the production line, in plant conditions, or on the warehouse shelves, with automated or manual systems.
- Developing on-line test solutions in environments where previously it was unimaginable (e.g. in vivo determination of rumen content).
- Evaluation of vegetation or heterogeneous mixtures on a processing line based on remote sensing hyperspectral images.
- Fixing the aroma profile of the product for quality assurance and identification purposes.
- Masking unwanted odors with additional scents, or creating a desired aroma based on the instrumental fragrance and taste profile.
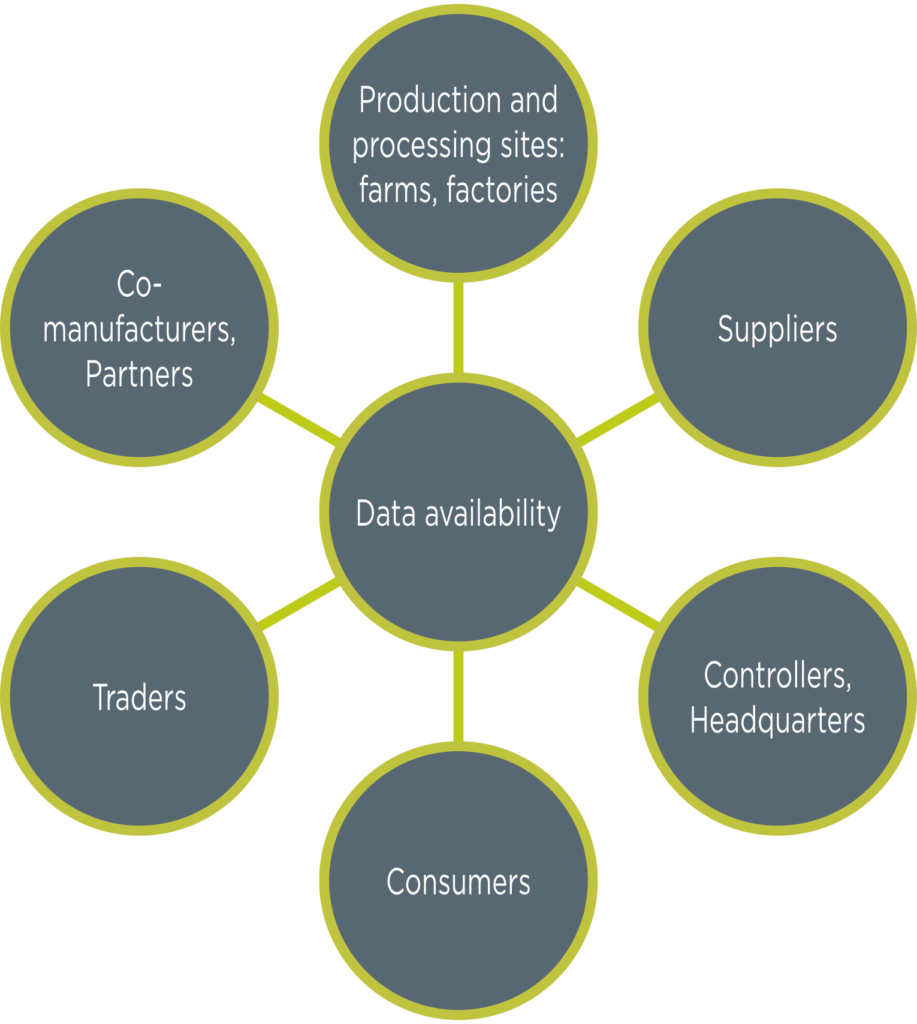
- Collecting and evaluating data from different locations and sources to support decision-making systems.
Reference works
We are often asked what the analytical methods and services presented above are suitable for in practice, can we give an example when they have been proven useful…
- honey vs. sugar syrup – product identification in minutes, on site – NIR
- regulation of the production of vegetable foods based on the moisture content – NIR
- how can a laboratory mislead a complete factory? – raw material and end-product testing – NIR
- objective indication of foreign odors in processed meat – aroma analysis
- Does the cheese have a noticeable fishy smell? Effect of feed on the aroma of the processed product – aroma analysis
- what is harmful in the raw material? Detection of counterfeiting and harmful substances – NIR
- let’s make food healthier, but how smelly can it be?! effect of raw materials on the smell of products – aroma analysis
- we already have a NIR system! – but is it used correctly?! how can you be misled?
- was the yogurt really made by probiotic bacteria? – NIR + aroma analysis
- stored frozen, what could be wrong? food flavor change – flavor analysis
- cats are picky animals – preference and aroma relationship – aroma analysis
- Is the silage fermented properly? Examination of preserved feedstuffs – NIR and aroma analysis
…WE CAN! 😊